


An organizational chart, also known as an org chart, is a diagram that illustrates the structure of an organization and the relationships between its positions or departments. An org chart provides a clear visual representation of the company’s hierarchy, roles, and responsibilities, which can help ensure that everyone is on the same page and working towards the same goals.
Creating an organizational chart may seem like a daunting task, but with the right tools and guidelines, it can be a straightforward and valuable process. In this article, we’ll provide a complete guide to making an organizational chart.

Step 1: Determine the Purpose and Scope of the Organizational Chart
Before you begin creating an organizational chart, you need to determine its purpose and scope. Ask yourself what you want to achieve with the chart, who the target audience is, and what level of detail is necessary. For example, do you need a high-level overview of the company’s structure or a detailed breakdown of every department and position? Once you have a clear understanding of the chart’s purpose and scope, you can move on to the next step.
Step 2: Gather Information About the Company’s Structure
To create an accurate org chart, you’ll need to gather information about the company’s structure. This can include:
- The names and positions of everyone in the company
- The departments or teams within the company
- The hierarchy of positions and departments
- The reporting structure of each position
- The roles and responsibilities of each position
- You can gather this information by talking to managers and employees, reviewing job descriptions and company policies, and analyzing the company’s organizational structure documents.
Step 3: Choose the Type of Organizational Chart
There are several types of organizational charts, and the one you choose will depend on the company’s structure and the chart’s purpose. Here are a few common types:
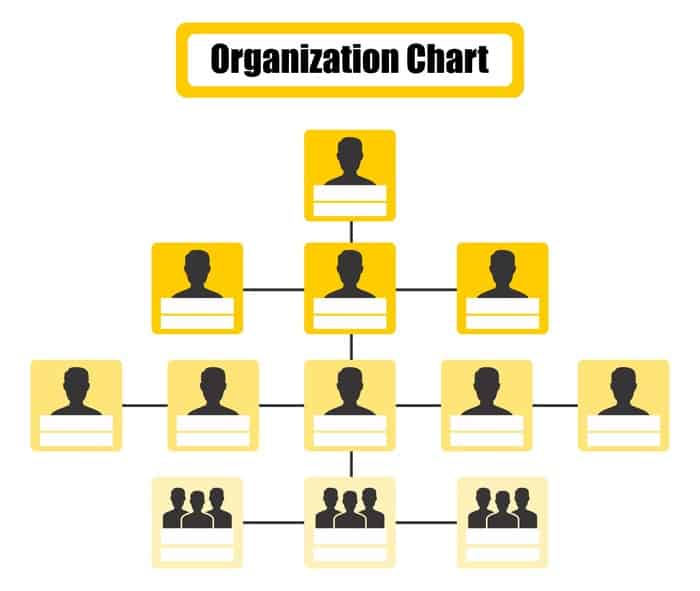
Hierarchical Organizational Chart:
This is the most common format of organizational charts, also known as the traditional organizational chart. It displays the hierarchical structure of the organization, starting from the highest level of leadership to the lowest level of employees. It shows the chain of command, the decision-making process, and who reports to whom. This format is suitable for organizations with a well-defined chain of command and a clear distinction between different departments.
Flat Organizational Chart:
This format is suitable for smaller businesses with a more relaxed management style, where employees have more autonomy and flexibility. In a flat organizational chart, there are fewer levels of management, and employees have more direct contact with the decision-makers. This format is ideal for startups, small businesses, and organizations that prioritize innovation, collaboration, and creativity.
Matrix Organizational Chart:
A matrix organizational chart displays the company’s structure based on function and project. In this format, employees report to both a functional manager and a project manager, depending on their area of expertise. This format is ideal for organizations that work on complex projects, where employees need to collaborate across different departments and have a clear understanding of their roles and responsibilities.
Circular Organizational Chart:
A circular organizational chart is a non-traditional format that represents the company’s structure in a circular or radial format, with the top management position at the center and other departments branching outwards. This format is ideal for organizations with a flat structure or a collaborative work culture, as it emphasizes the interconnectedness of different departments and promotes a sense of equality and collaboration.
Mind Mapping Organizational Chart:
A mind-mapping organizational chart is a visual representation of the company’s structure and operations that focuses on the interconnectivity of different departments and functions. It uses diagrams, images, and text to represent different ideas and concepts, with the top management position at the center and different departments branching outwards. This format is suitable for organizations that want to highlight the creative and innovative aspects of their operations and promote a collaborative work culture.
Step 4: Create the Organizational Chart
Once you have gathered the necessary information, chosen the type of organizational chart, and selected the correct organizational chart maker for creating the chart, it’s time to start building the chart itself. Here are the steps to follow:
- Start with the top-level position or the highest level of hierarchy in the company.
- Add the names and titles of the positions that report to the top-level position.
- Continue adding positions and departments to the chart until you reach the lowest level.
- Add lines or arrows to show the reporting structure between positions.
- Add any additional information, such as job descriptions or key responsibilities.
Step 5: Review and Refine the Organizational Chart
Once you have completed the initial draft of the organizational chart, it’s important to review and refine it. Here are a few things to consider:
- Is the chart accurate and up-to-date?
- Is the chart easy to read and understand?
- Are the positions and departments clearly defined?
- Are the lines and arrows clearly showing the reporting structure?
- Are any positions missing from the chart?


Step 6: Share and Use the Organizational Chart
Creating an organizational chart is an important step in building a successful business, but it’s not enough to simply create the chart. You also need to make sure it is effectively shared and used throughout your organization. Before you share your organizational chart, you need to determine the best format for your audience. This will depend on the size of your company and how your employees access information.
For smaller companies, a simple printed or digital version of the chart may be sufficient. However, for larger organizations, an interactive online version that can be easily updated and accessed by all employees may be more effective. Consider the needs of your audience and the technology available to them when determining the best format for sharing your chart.
In addition, the chart can help identify opportunities for professional development and career growth. For example, if an employee expresses interest in moving into a new department, the chart can help managers identify potential opportunities and career paths.
Conclusion
Creating an organizational chart is a key step in building a successful business. It helps you understand the structure of your organization, identify areas for improvement, and ensure that everyone is clear on their roles and responsibilities. By following the steps outlined in this guide, you can create an effective organizational chart that accurately reflects your company’s structure and helps drive growth.
Remember, your organizational chart should be a living document that you review and update regularly as your company evolves. With a clear and up-to-date chart, you can ensure that your team is aligned and working towards your business goals.

